What Happened at Corvus CRO Last Week
Projecting The Yearly Impact of a Successful Split Test
Estimating the yearly impact from a successful test is important to monitoring test program success. A very basic way to calculate yearly impact is to figure out the gain per day and multiply by 365. Gain per day can be determined by taking a goal conversion total from the strongest performing variation, subtract the baseline conversion, and divide by number of days run. Expressed as a formula:
Daily Gain = (Strongest Variation - Baseline) ÷ Days Run
Here is an example using the total revenue goal:
- Strongest Variation: $323,515.27
- Baseline Variation: $303,350.90
- Days Run: 33
$611.04 = ($323,515.27 - $303,350.90) ÷ 33
The strongest variation generated and additional $611.04 per day. 365 days in a year, so multiply:
$223,030.15 = $611.04 × 365
A yearly impact of $223,030.15. Sounds great, right? Not quite. This approach is too basic; it does not account for seasonality. All sites have peaks and valleys throughout the year. The above calculations assume day-to-day consistency. In the real world, it’s uncommon to have consistent daily behavior. A more accurate method for estimating yearly impact will account for seasonality.
Accounting for Seasonality
One way to address seasonality is to think of it like “how much of our traffic for the year did we get during this time period?”. For purposes of calculation, this can be expressed as a percentage. Here’s an example:
- Test Start Date: 11/08/18
- Test End Date: 12/11/18
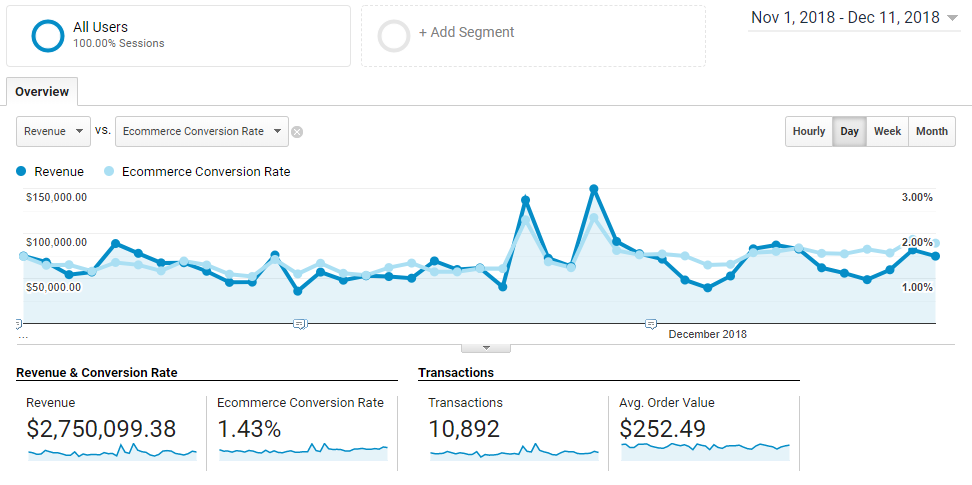
- Visitor Count Over Duration (11/01/18 – 12/11/18): 410,304
- Visitor Count Over Year (12/11/17 – 12/11/18): 4,234,722
410,304 ÷ 4,234,722 = 9.69%
Looking back a year, 9.69% of the traffic came through while the test was running. That percentage can be used to calculate an estimated yearly impact using the difference between the strongest variation and baseline, like so:
Yearly Impact = 100 * (Strongest Variation - Baseline) ÷ Seasonality Percentage
Using our previous data:
- Strongest Variation: $323,515.27
- Baseline Variation: $303,350.90
- Seasonality Percentage: 9.69%
$208,115.21 = 100 * ($323,515.27 - $303,350.90) ÷ 9.69%
An estimated yearly impact of $208,115.21 when using a traffic seasonality percentage. Now, traffic seasonality doesn’t always cleanly line up with order conversion or revenue seasonality, so calculate percentages for those as well:
- Orders Over Duration: 9,319
- Orders Over Year: 85,933
- Order Seasonality %: 10.84%
- Revenue Over Duration: $2,328,719.54
- Revenue Over Year: $21,956,225.37
- Revenue Seasonality %: 10.61%
With the two additional percentages, we now have four potential estimates for yearly impact:
- Simple gain per day: $223,811.94
- Visitor seasonal weight: $208,115.21
- Order seasonal weight: $185,941.07
- Revenue seasonal weight: $190,118.84
which you can interpret separately, average together, or otherwise manipulate as strategy dictates.
Automating The Data Collection Process
There’s a lot of data points that need to be collected to take advantage of the above process. It could take an hour or more to collect all the necessary data points between the testing tool and analytics:
- Test Start Date
- Test End Date
- Conversion Total for Strongest Variation
- Conversion Total for Baseline
- Visitors Over Duration
- Visitors Over Previous Year
- Orders Over Duration
- Orders Over Previous Year
- Revenue Over Duration
- Revenue Over Previous Year
That’s a lot of time devoted to data collection and entry, for every single split test. It’s unsatisfying busywork and prone to transposition errors. All of the data points are known and consistent. This is a prime area for automation.
Which is exactly what I did last week using a combination of JavaScript, Airtable, and Zapier. Wrote a JavaScript snippet to scrape the HTML of a split test result for the relevant test data and uploads it to the split test database set up in Airtable. Set up a Zapier automation that runs a report in Google Analytics to grab the data needed for seasonality percentage calculation and uploads that to Airtable as well. Calculations are done in Airtable with formulas.
This is a very bootstrapped solution, but condenses an hour of work down into about a minute and completely eliminates potential transposition errors. Roadmap of improvements:
- Replace HTML scraping with data requests using split test tool API
- Trigger process automatically on completion of a test so no human work is needed at all
- Incorporate audience and device filtration into data collection from analytics reports
- Expand to metrics other than visitors, order conversion, and revenue (limits current process value to eCommerce sites)
- Internalize systems and not rely on outside SaaS products
Help Wanted
This is a great first step, but to take the tool to the next level, I’m going to need some help. Looking for the following:
- Developer: take the tool out of the bootstrap stage and work on the feature roadmap
- Data scientist: review, poke holes, and improve the data calculation and estimation process outlined above
If you know someone that would be interested in either of those roles and has an interest in conversion optimization, split testing, and automation, please ask them to email me (matt@corvuscro.com) or connect with me on LinkedIn.